Linux
How to Monitor the Real-time Performance Of Ubuntu 20.04 Using Netdata
Netdata is an open-source real-time monitoring tool that provides real-time performance metrics of your server. It’s widely used by sysadmins, and operation teams to keep tabs on the health of both on-premise and cloud systems. In this guide, you will learn how to monitor the real-time performance of Netdata on Ubuntu.
Features of Netdata
Before we get down to installing Netdata, let’s briefly have an overview of some of the key features.
- Elegant and stunningly fast visualizations with responsive dashboards that respond to queries in less than 1ms.
- Minimal disk I/O.
- Low resource utilization – Netdata uses up just a few MBs of RAM and 1% CPU utilization per CPU core.
- Unlimited metrics: Netdata has the ability to collect a vast range of system metrics.
- Zero configuration – Netdata autodetects all the services out of the box and collects up to 10,000 metrics.
How to install Netdata on Ubuntu 20.04
Netdata is basically a monitoring agent that is created to run on Linux, macOS, FreeBSD, and containerization platforms such as Docker. As stated earlier, Netdata can be used on both physical and virtual servers, even including IoT and edge devices.
Before installing Netdata, you can gather information about it using the apt command:
|
1 |
$ apt show netdata |
The most recommended method of installing Netdata is using an automated installation script that works out of the box for all major Linux distributions such as Debian, Ubuntu, CentOS, and Fedora.
To start the installation, run the automated script as shown.
$ bash <(curl -Ss https://my-netdata.io/kickstart.sh)
The script installs Netdata from source. It will begin by autodetecting your system’s distribution and version.
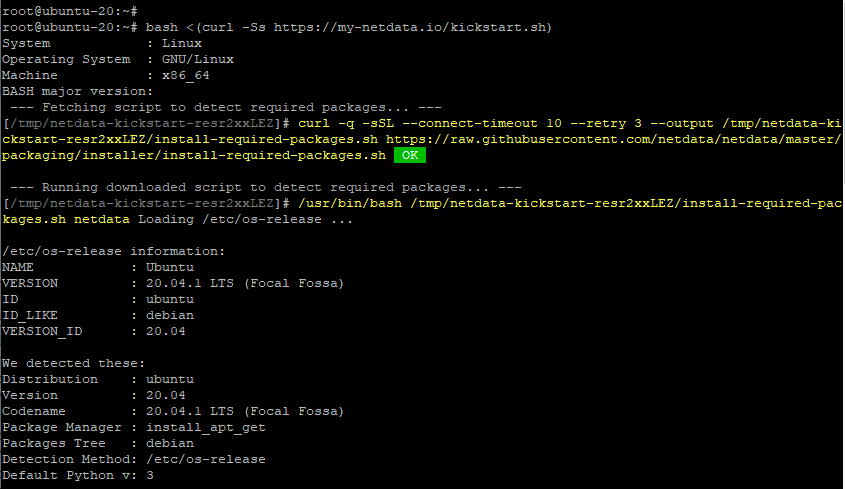
Thereafter, it will download and install all the requisite packages , dependencies and build tools. The script runs interactively, therefore be keen when you are prompted to hit ENTER.
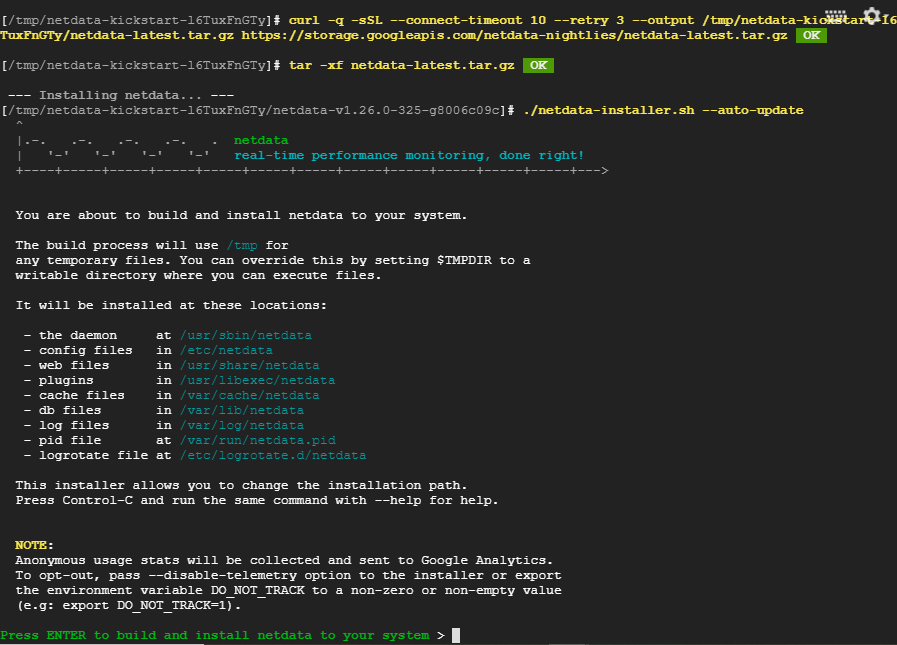
Upon successful installation, you will get the following output. This confirms that the installation went on as planned.
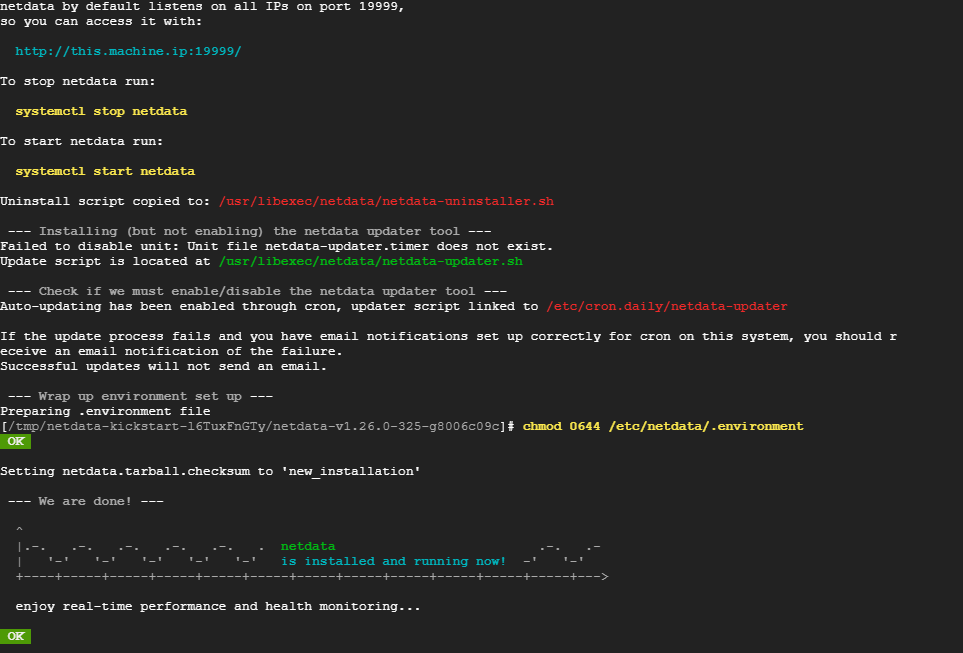
Running Netdata as a service
By default, Netdata listens on port 19999. You can verify this using the netstat command shown.
|
1 |
$ netstat -plntu |

Netdata can be run as a systemd service unit. For example, to check the status of netdata, run the command.
|
1 |
$ systemctl status netdata |
To stop Netdata, run the command.
|
1 |
$ systemctl stop netdata |
To start Netdata, run the command.
|
1 |
$ systemctl start netdata |
Monitor real-time performance of Netdata on Ubuntu
To access Netdata , open your browser and browse the URL:
|
1 |
http://server-IP:19999/ |
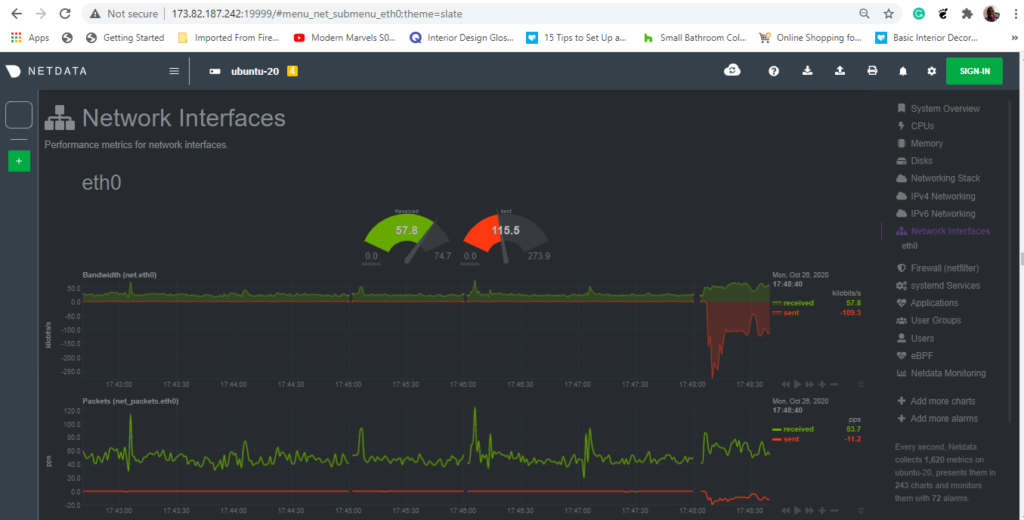
You should get the dashboard below giving you an overview of the system metrics such as CPU and memory utilization.
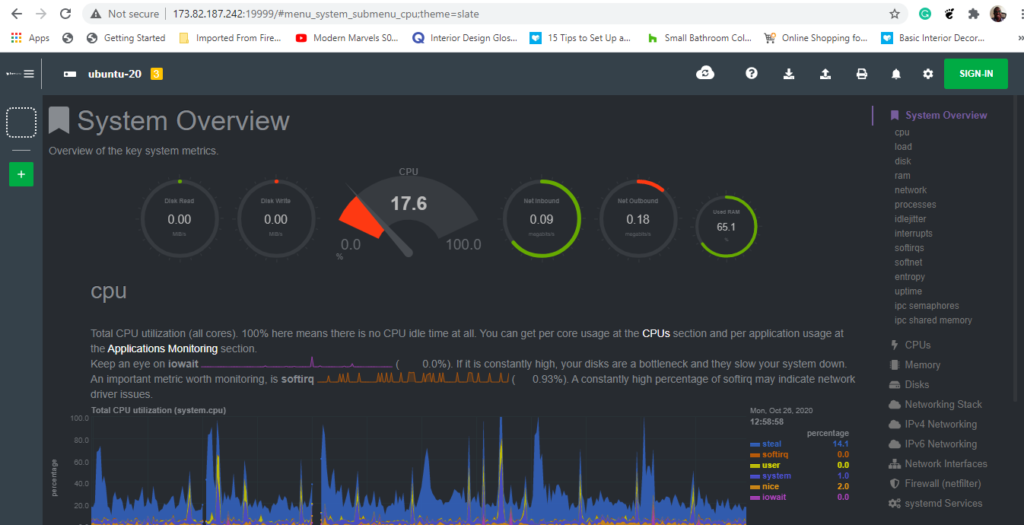
On the right side panel are various system metrics on which you can click on to view the dashboards. For example, to view network statistics, click on the ‘Network interfaces‘ option.
And that’s what we had for today. In this guide, you learned how to monitor the real-time peformance of Netdata on Ubuntu 20.04.
-

 DevOps55 years ago
Saltstack Tutorial for beginners [2023]
-

 DevOps55 years ago
How to build a Docker cron job Container easily [2023]
-

 Linux55 years ago
mail Command in Linux/Unix with 10+ Examples [2023]
-

 DevOps55 years ago
Docker ADD vs COPY vs VOLUME – [2023]
-
 DevOps55 years ago
How to setup Pritunl VPN on AWS to Access Servers
-

 Linux55 years ago
Grep Command In Unix/Linux with 25+ Examples [2023]
-
Linux55 years ago
How To setup Django with Postgres, Nginx, and Gunicorn on Ubuntu 20.04
-

 Linux55 years ago
Find command in Unix/Linux with 30+ Examples [2023]

